Three stages turn a raw electrical signal into a documented health reading: a controlled measurement, a mathematical separation of what that measurement actually contains, and a model that recognizes what it means.
Multi-frequency EIS
An alternating current is applied across a spectrum of frequencies to measure a battery's internal resistance and chemical dynamics. This replaces slow, inaccurate capacity cycling: instead of a single-frequency reading, a multi-sine excitation captures a complete electrochemical fingerprint of the module in one controlled measurement.
Because the signal is controlled rather than a full charge/discharge cycle, the test evaluates the cell's true internal state without altering its charge or temperature. And because it's a direct electrochemical measurement, it doesn't depend on the module's BMS having logged a usable history.
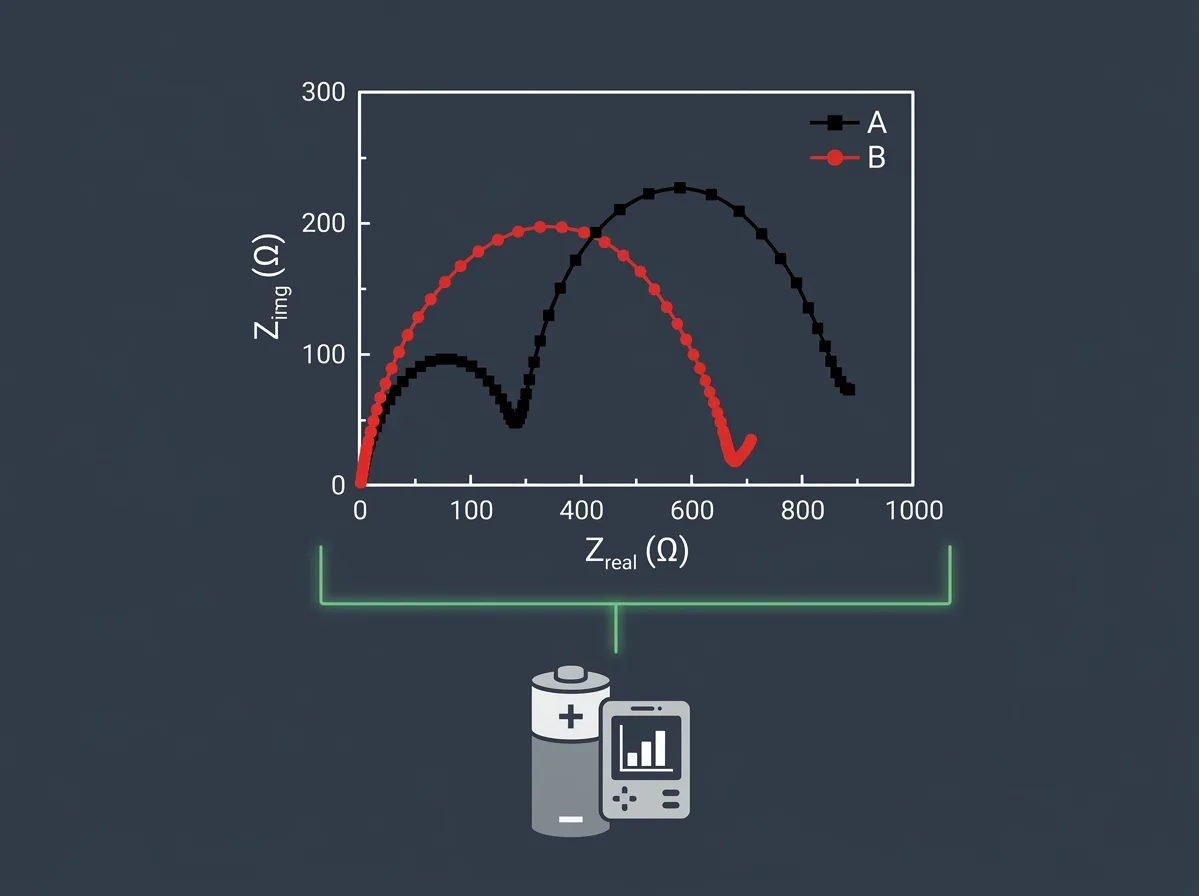
Distribution of Relaxation Times (DRT)
Raw impedance data is a tangle of overlapping electrochemical processes that traditional models struggle to separate. DRT deconvolution transforms the frequency spectrum to isolate individual time constants — lithium-ion diffusion, charge-transfer kinetics — without relying on a predefined equivalent circuit.
The result is a clear view of the battery's internal mechanics, decomposed into the physical phenomena actually driving them.
AI-driven pattern recognition and ECM
Once DRT isolates the internal signals, a machine learning model cross-references the distinct peaks against known degradation curves and feeds the result into adaptive Equivalent Circuit Models (ECM). Rather than a static analysis, this dynamically recognizes specific aging patterns — Solid Electrolyte Interphase (SEI) growth, early lithium-plating risk — as they appear.
The combination of deconvolution and modeling is what turns a raw curve into empirical evidence of State of Health, and what flags a module before it's routed somewhere it shouldn't be.
From reading to certified asset
The output is built toward EN 18061 alignment and the EU Digital Battery Passport data format — turning a single measurement into a structured, independent, auditable health record that travels with the battery.